
Below are some of the sources as well as additional information to the blood type frequencies by countries:
A big thank you to Lasse Westvang Hougaard for contributing to these studies.
See also: Genotype distributions.
See also: Blood Type Frequencies by Regions, Tribes and Ethnic Groups including the Rh Factor.
Don't know where to start?
| Country | Population | O+ | A+ | B+ | AB+ | O- | A- | B- | AB- |
|---|---|---|---|---|---|---|---|---|---|
| Albania | 2,876,000 | 28.85% | 34.45% | 15.66% | 10.29% | 3.8% | 4.47% | 0.45% | 1.34% |
| Argentina | 41,343,201 | 45.4% | 34.26% | 8.59% | 2.64% | 8.4% | 0.44% | 0.21% | 0.06% |
| Armenia | 2,931,568 | 29.0% | 46.3% | 12.0% | 5.6% | 2.0% | 3.7% | 1.0% | 0.4% |
| Australia | 21,262,641 | 40.0% | 31.0% | 8.0% | 2.0% | 9.0% | 7.0% | 2.0% | 1.0% |
| Austria | 8,210,281 | 30.0% | 33.0% | 12.0% | 6.0% | 7.0% | 8.0% | 3.0% | 1.0% |
| Bahrain | 1,234,571 | 48.48% | 19.35% | 22.61% | 3.67% | 3.27% | 1.33% | 1.04% | 0.25% |
| Bangladesh | 161,083,804 | 31.18% | 21.44% | 34.58% | 8.85% | 1.39% | 0.96% | 0.96% | 0.64% |
| Belgium | 10,414,336 | 38.0% | 34.0% | 8.5% | 4.1% | 7.0% | 6.0% | 1.5% | 0.8% |
| Bolivia | 10,088,108 | 51.62% | 29,45% | 10.11% | 1,15% | 4,39% | 2,73% | 0,54% | 0.1% |
| Bosnia and Herzegovina | 3,792,730 | 31.0% | 36.0% | 12.0% | 6.0% | 5.0% | 7.0% | 2.0% | 1.0% |
| Brazil | 198,739,269 | 36.0% | 34.0% | 8.0% | 2.5% | 9.0% | 8.0% | 2.0% | 0.5% |
| Bulgaria | 7,045,097 | 28.0% | 37.0% | 13.0% | 7.0% | 5.0% | 7.0% | 2.0% | 1.0% |
| Canada | 33,487,208 | 39.0% | 36.0% | 7.6% | 2.5% | 7.0% | 6.0% | 1.4% | 0.5% |
| Cambodia | 14,952,665 | 46.7% | 27.2% | 18.5% | 4.9% | 1.3% | 0.8% | 0.5% | 0.1% |
| Cameroon | 19,958,000 | 42.8% | 38.8% | 12.0% | 3.3% | 1.4% | 1.2% | 0.4% | 0.1% |
| Chile | 17,114,000 | 85.6% | 8.7% | 3.35% | 0.99% | 1.2% | 0.1% | 0.05% | 0.1% |
| China | 1,339,724,852 | 47.7% | 27.8% | 18.9% | 5.0% | 0.3% | 0.2% | 0.1% | 0.03% |
| Colombia | 49,069,267 | 61.3% | 26.11% | 2.28% | 1.47% | 5.13% | 2.7% | 0.7% | 0.31% |
| Democratic Republic of the Congo | 78,740,000 | 59.5% | 21.3% | 15.2% | 2.4% | 1.0% | 0.3% | 0.2% | 0.1% |
| Croatia | 4,207,355 | 29.0% | 36.0% | 15.0% | 5.0% | 5.0% | 6.0% | 3.0% | 1.0% |
| Cuba | 11,480,000 | 45.55% | 32.77% | 9.47% | 2.35% | 5% | 3.58% | 1.03% | 0.25% |
| Cyprus | 1,189,395 | 35.22% | 40.35% | 11.11% | 4.72% | 3.85% | 3.48% | 0.87% | 0.40% |
| Czech Republic | 10,532,770 | 27.0% | 36.0% | 15.0% | 7.0% | 5.0% | 6.0% | 3.0% | 1.0% |
| Denmark | 5,500,510 | 35.0% | 37.0% | 8.0% | 4.0% | 6.0% | 7.0% | 2.0% | 1.0% |
| Dominican Republic | 9,445,281 | 46,2% | 26,4% | 16,9% | 3,1% | 3,7% | 2,1% | 1,4% | 0,2% |
| Ecuador | 16,665,756 | 75.0% | 14.0% | 7.1% | 0.5% | 2.38% | 0.7% | 0.3% | 0.02% |
| Egypt | 90,000,000 | 52.0% | 24.0% | 12.4% | 3.8% | 5.0% | 2.0% | 0.6% | 0.2% |
| El Salvador | 6,171,483 | 62.0% | 23.0% | 11.0% | 1.0% | 1.0% | 1.0% | 0.7% | 0.3% |
| Estonia | 1,299,371 | 29.5% | 30.8% | 20.79.2% | 6.4% | 4.3% | 4.5% | 3.0% | 0.9% |
| Ethiopia | 84,320,987 | 39.0% | 28.0% | 21.0% | 5.0% | 3.0% | 2.0% | 1.0% | 1.0% |
| Fiji | 912,208 | 43.0% | 33.3% | 16.5% | 4.8% | 1.0% | 0.7% | 0.5% | 0.2% |
| Finland | 5,250,275 | 27.0% | 38.0% | 15.0% | 7.0% | 4.0% | 6.0% | 2.0% | 1.0% |
| France | 62,150,775 | 36.0% | 37.0% | 9.0% | 3.0% | 6.0% | 7.0% | 1.0% | 1.0% |
| Germany | 82,329,758 | 35.0% | 37.0% | 9.0% | 4.0% | 6.0% | 6.0% | 2.0% | 1.0% |
| Ghana | 28,308,301 | 53.8% | 17.6% | 18.3% | 2.8% | 4.5% | 1.3% | 1.3% | 0.2% |
| Greece | 10,892,849 | 37.4% | 32.9% | 11.0% | 3.7% | 7.0% | 5.0% | 2.0% | 1.0% |
| Guinea | 10,324,000 | 46.88% | 21.64% | 22.86% | 4.52% | 2.0% | 0.9% | 1.0% | 0.2% |
| Honduras | 9,348,898 | 57.5% | 27.0% | 7.8% | 2.5% | 2.7% | 1.7% | 0.6% | 0.2% |
| Hong Kong | 7,055,071 | 41.51% | 26.13% | 25.34% | 6.35% | 0.32% | 0.17% | 0.14% | 0.05% |
| Hungary | 9,787,801 | 27.0% | 33.0% | 16.0% | 8.0% | 5.0% | 7.0% | 3.0% | 1.0% |
| Iceland | 306,694 | 47.6% | 26.4% | 9.3% | 1.6% | 8.4% | 4.6% | 1.7% | 0.4% |
| India | 1,210,193,422 | 27.85% | 20.8% | 38.13% | 8.93% | 1.43% | 0.57% | 1.79% | 0.49% |
| Indonesia | 237,424,363 | 36.82% | 25.87% | 28.85% | 7.96% | 0.18% | 0.13% | 0.15% | 0.04% |
| Iran | 80,982,137 | 33.5% | 27.0% | 22.2% | 7.0% | 4.0% | 3.0% | 2.5% | 0.8% |
| Iraq | 32,961,959 | 32.2% | 25.0% | 25.6% | 7.4% | 3.6% | 2.7% | 2.7% | 0.9% |
| Ireland | 4,203,200 | 47.0% | 26.0% | 9.0% | 2.0% | 8.0% | 5.0% | 2.0% | 1.0% |
| Israel | 7,233,701 | 32.0% | 34.0% | 17.0% | 7.0% | 3.0% | 4.0% | 2.0% | 1.0% |
| Italy | 61,261,254 | 40.0% | 36.0% | 7.5% | 2.5% | 7.0% | 6.0% | 1.5% | 0.5% |
| Ivory Coast | 23,869,656 | 46.5% | 22.5% | 22.5% | 4.3% | 2.0% | 1.0% | 1.0% | 0.2% |
| Jamaica | 2,889,187 | 47.0% | 23.0% | 20.0% | 3.0% | 3.5% | 2.0% | 1.0% | 0.5% |
| Japan | 127,368,088 | 29.9% | 39.8% | 19.9% | 9.9% | 0.15% | 0.2% | 0.1% | 0.05% |
| Kazakhstan | 18,431,447 | 30.7% | 29.8% | 24.2% | 8.3% | 2.3% | 2.2% | 1.8% | 0.7% |
| Kenya | 40,863,000 | 45.6% | 25.2% | 21.1% | 4.2% | 1.8% | 1.0% | 0.9% | 0.02% |
| Korea | 73,000,000 | 36.6% | 32.8% | 21.0% | 9.0% | 0.4% | 0.2% | 0.09% | 0.03% |
| Latvia | 1,944,122 | 30.6% | 31.0% | 17.0% | 6.0% | 5.4% | 6.0% | 3.0% | 1.0% |
| Lebanon | 4,292,000 | 38.4% | 32.3% | 9.4% | 3.2% | 7.7% | 6.5% | 1.7% | 0.7% |
| Libya | 6,422,772 | 42.64% | 28.86% | 11.16% | 4.5% | 6.26% | 4.24% | 1.64% | 0.67% |
| Lithuania | 2,827,573 | 36.0% | 33.0% | 11.0% | 4.0% | 7.0% | 6.0% | 2.0% | 1.0% |
| Luxemburg | 587,297 | 35.0% | 37.0% | 9.0% | 4.0% | 6.0% | 6.0% | 2.0% | 1.0% |
| Macao | 606,413 | 41.5% | 26.1% | 25.4% | 6.3% | 0.33% | 0.17% | 0.15% | 0.05% |
| Macedonia | 2,083,690 | 29.36% | 38.45% | 13,08% | 6.54% | 3.27% | 5.09% | 2.36% | 1.09% |
| Malaysia | 28,334,135 | 34.32% | 30.35% | 27.36% | 7.46% | 0.17% | 0.15% | 0.14% | 0.04% |
| Mauritania | 3,359,185 | 46.3% | 26.68% | 17.46% | 3.85% | 2.8% | 1.6% | 1.1% | 0.2% |
| Mauritius | 1,267,303 | 38.3% | 26.0% | 25.0% | 6.7% | 1.7% | 1.0% | 1.0% | 0.3% |
| Mexico | 108,396,211 | 55.79% | 29.9% | 8.0% | 1.63% | 2.7% | 1.5% | 0.4% | 0.08% |
| Republic of Moldova | 4,043,722 | 28.5% | 31.8% | 17.6% | 7.0% | 5.0% | 6.0% | 3.0% | 1.1% |
| Mongolia | 3,179,997 | 56.4% | 27.7% | 10.9% | 4.96% | 0.6% | 0.3% | 0.1% | 0.04% |
| Morocco | 36,328,588 | 42.3% | 29.8% | 14.3% | 4.1% | 4.5% | 3.1% | 1.5% | 0.4% |
| Myanmar | 53,507,932 | 35.7% | 23.8% | 32.7% | 6.95% | 0.3% | 0.2% | 0.3% | 0.05% |
| Nepal | 29,853,000 | 35.2% | 28.3% | 27.1% | 8.6% | 0.3% | 0.2% | 0.2% | 0.1% |
| Netherlands | 16,715,999 | 39.5% | 35.0% | 6.7% | 2.5% | 7.5% | 7.0% | 1.3% | 0.5% |
| New Zealand | 4,213,418 | 38.0% | 32.0% | 9.0% | 3.0% | 9.0% | 6.0% | 2.0% | 1.0% |
| Nigeria | 152,217,341 | 51.3% | 22.4% | 20.7% | 2.6% | 1.6% | 0.7% | 0.6% | 0.1% |
| Norway | 4,660,539 | 34.0% | 42.5% | 6.8% | 3.4% | 6.0% | 7.5% | 1.2% | 0.6% |
| Pakistan | 180,440,005 | 24.63% | 20.6% | 34.43% | 9.52% | 4.17% | 2.66% | 3.57% | 0.45% |
| Papua New Guinea | 7,952,511 | 48.0% | 37.2% | 9.6% | 2.8% | 1.0% | 0.8% | 0.4% | 0.2% |
| Peru | 29,907,003 | 70.0% | 18.4% | 7.8% | 1.6% | 1.4% | 0.5% | 0.28% | 0.02% |
| Philippines | 92,337,852 | 36.9% | 28.9% | 26.9% | 6.97% | 0.1% | 0.1% | 0.1% | 0.03% |
| Poland | 38,482,919 | 26.6% | 31.26% | 15.73% | 6.75% | 6.51% | 7.65% | 3.85% | 1.65% |
| Portugal | 10,707,924 | 36.2% | 39.8% | 6.6% | 2.9% | 6.0% | 6.6% | 1.1% | 0.5% |
| Romania | 19,237,087 | 28.0% | 37.0% | 14.0% | 7.0% | 5.0% | 6.0% | 2.0% | 1.0% |
| Russia | 143,300,000 | 46.0% | 31.0% | 9.0% | 2.1% | 6.0% | 4.0% | 1.0% | 0.9% |
| Saudi Arabia | 28,686,633 | 48.0% | 24.0% | 17.0% | 4.0% | 4.0% | 2.0% | 1.0% | 0.3% |
| Serbia | 7,224,000 | 31.92% | 35.28% | 12.6% | 4.2% | 6.08% | 6.72% | 2.4% | 0.8% |
| Singapore | 5,784,819 | 43.6% | 23.9% | 24.4% | 6.0% | 0.9% | 0.7% | 0.4% | 0.1% |
| Slovakia | 5,432,265 | 27.2% | 35.7% | 15.3% | 6.8% | 4.8% | 6.3% | 2.7% | 1.2% |
| Slovenia | 2,071,258 | 31.0% | 33.0% | 12.0% | 6.0% | 7.0% | 7.0% | 3.0% | 1.0% |
| South Africa | 49,320,000 | 39.0% | 32.0% | 12.0% | 3.0% | 7.0% | 5.0% | 2.0% | 1.0% |
| Spain | 40,525,002 | 36.0% | 34.0% | 8.0% | 2.5% | 9.0% | 8.0% | 2.0% | 0.5% |
| Sudan | 40,827,975 | 48.0% | 27.7% | 15.2% | 2.8% | 3.5% | 1.8% | 0.8% | 0.2% |
| Sweden | 9,059,651 | 32.0% | 37.0% | 10.0% | 5.0% | 6.0% | 7.0% | 2.0% | 1.0% |
| Switzerland | 8,000,000 | 26.0% | 37.0% | 13.0% | 7.0% | 5.0% | 6.0% | 4.0% | 2.0% |
| Syria | 22,530,746 | 43.0% | 30.0% | 14.0% | 3.7% | 5.0% | 3.0% | 1.0% | 0.3% |
| Taiwan | 23,234,936 | 43.9% | 25.9% | 23.9% | 6.0% | 0.1% | 0.1% | 0.01% | 0.02% |
| Thailand | 66,720,153 | 40.8% | 16.9% | 36.8% | 4.97% | 0.2% | 0.1% | 0.2% | 0.03% |
| Turkey | 76,805,524 | 29.8% | 37.8% | 14.2% | 7.2% | 3.9% | 4.7% | 1.6% | 0.8% |
| Uganda | 43,276,492 | 43.7% | 39.0% | 10.7% | 3.9% | 1.3% | 1.0% | 0.3% | 0.1% |
| Ukraine | 44,404,078 | 32.0% | 34.0% | 15.0% | 5.0% | 5.0% | 6.0% | 2.0% | 1.0% |
| United Arab Emirates | 4,707,000 | 44.1% | 21.9% | 20.8% | 4.3% | 4.3% | 2.1% | 2.0% | 0.4% |
| United Kingdom | 61,113,205 | 37.0% | 35.0% | 8.0% | 3.0% | 7.0% | 7.0% | 2.0% | 1.0% |
| United States | 307,212,123 | 37.4% | 35.7% | 8.5% | 3.4% | 6.6% | 6.3% | 1.5% | 0.6% |
| Venezuela | 32,011,082 | 58.5% | 28.3% | 5.3% | 1.8% | 3.5% | 1.7% | 0.7% | 0.2% |
| Vietnam | 95,414,640 | 41.7% | 21.9% | 30.8% | 4.98% | 0.3% | 0.1% | 0.2% | 0.02% |
| Yemen | 27,580,000 | 47.84% | 27.5% | 15.32% | 2.14% | 3.66% | 2.1% | 1.17% | 0.16% |
| Zimbabwe | 16,642,880 | 63.3% | 18.5% | 14.6% | 0.99% | 1.7% | 0.5% | 0.4% | 0.01% |
| Country | Population | O+ | A+ | B+ | AB+ | O- | A- | B- | AB- |
| Weighted mean | 6,416,019,550 | 38.67% | 27.42% | 22.02% | 5.88% | 2.55% | 1.99% | 1.11% | 0.36% |
The percentage of rh negatives worldwide is somewhere around 6%.
These numbers are expected to drop drastically for two reasons:
1) Most of the nations still missing are expected to have rh negative frequencies (sometimes far) below 6%.
2) Population growth more prevelant in countries with low rh negative percentages:
As you can probably see, some of the countries listed have seen a significant change in terms of population growth since starting this chart back in 2012.
Which are the fastest growing countries population wise?
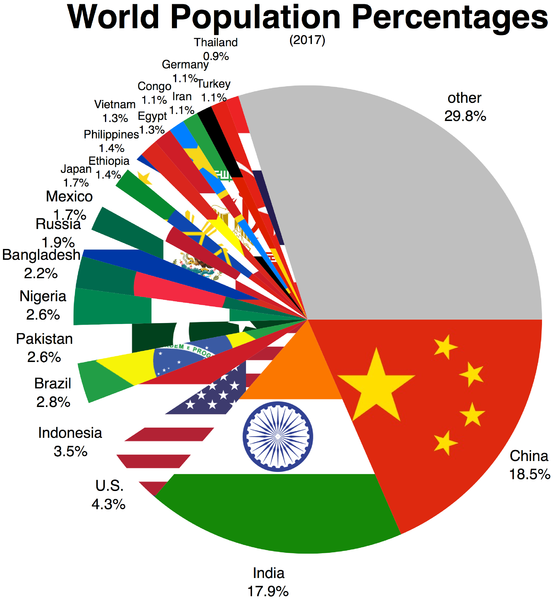
China and India stand out. Since 1990, China has grown by 233,805,000 people and India by more than 450 Million. 2,293,575,000 was the growth for the world during that timeframe making China and India combined responsible for more than 1/3rd of that increase.
What does this mean?
It is expected that China's popoulation growth will bring the percentages of rh negatives worldwide even lower.
India has an overall percentage of 4.23% rhesus negatives. There are regions where the percentages are quite higher, but also areas where they are lower.
Since India's percentage of rh negatives is lower than the world's average and China's percentage significantly lower,
we can expect the percentage of rh negatives worldwide to decrease drastically.
In addition, many of the nations with higher rh negative percentages in Europe are seeing a declining population. The overall population number of Europe is expected to declide in the near future.
It is expected that Asia's population will grow by another Billion people by the year 2050 and Africa is expected to see its population of a little more than 1 Billion people more than double within the same timeframe.
This does not mean that rh negative blood is headed for extinction.

This is why it is important to support networks all over the world helping find blood donors for rh negatives in need.
(Contact us on WhatsApp to see how you can help or receive help when you need it)
With a current world population of around 7.6 Billion, a 6% frequency would make the worldwide number of rh negatives somewhere around 456,000,000.
Below are the references for specific ethnic groups:
Why are there so many unreliable numbers floating around on the internet?
Many times, data is taken from blood banks and other services and it only takes one person responsible to provide percentages of rh negatives and ABO types to simply copy numbers from an international site to get people to share that false data for the nation on Wikipedia.
Another issue is that when you use numbers based on blood donors, you cannot forget that O negatives are especially targeted for donations. I have seen studies where 7.1% for O negatives shown up when in reality the overall number for rh negatives total was 2.3%.
So look at the actual studies. If the numbers are too round, look twice. And if you have some additional data, regional or national, feel free to connect with us.